Data Recap & Performance Infographics
Data Visualization • Performance Storytelling • Campaign Insights
A series of sponsored ads that appear directly within retailer catalogs, designed to communicate high-level brand messages rather than drive individual product sales. I manage the ad creation, deployment, and reporting, ensuring each campaign aligns with brand standards and resonates with shoppers in a native, catalog-style format.
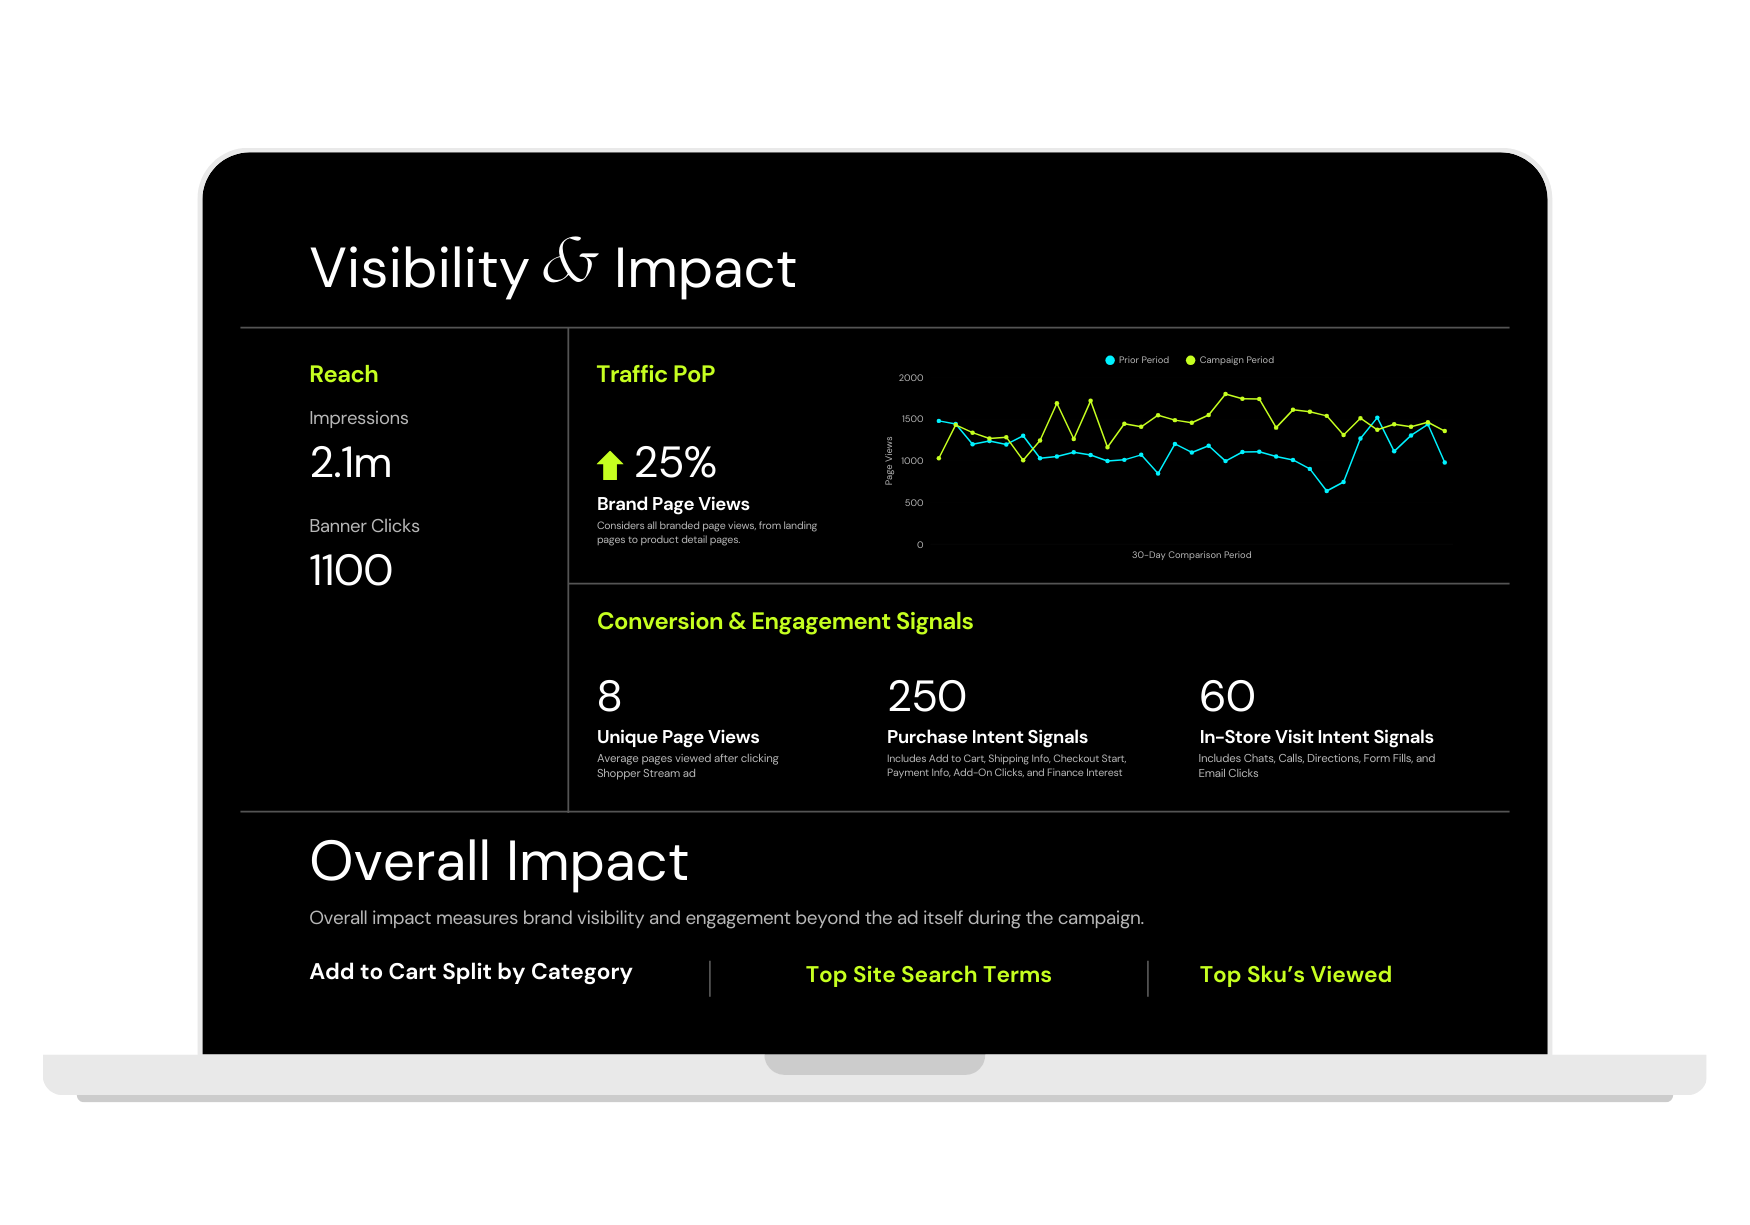
Following each promotional campaign and Shopper Stream initiative, I analyze performance data and translate it into infographic reports that highlight key outcomes and trends. The objective is to make complex data easy to understand while maintaining visual consistency and brand clarity.
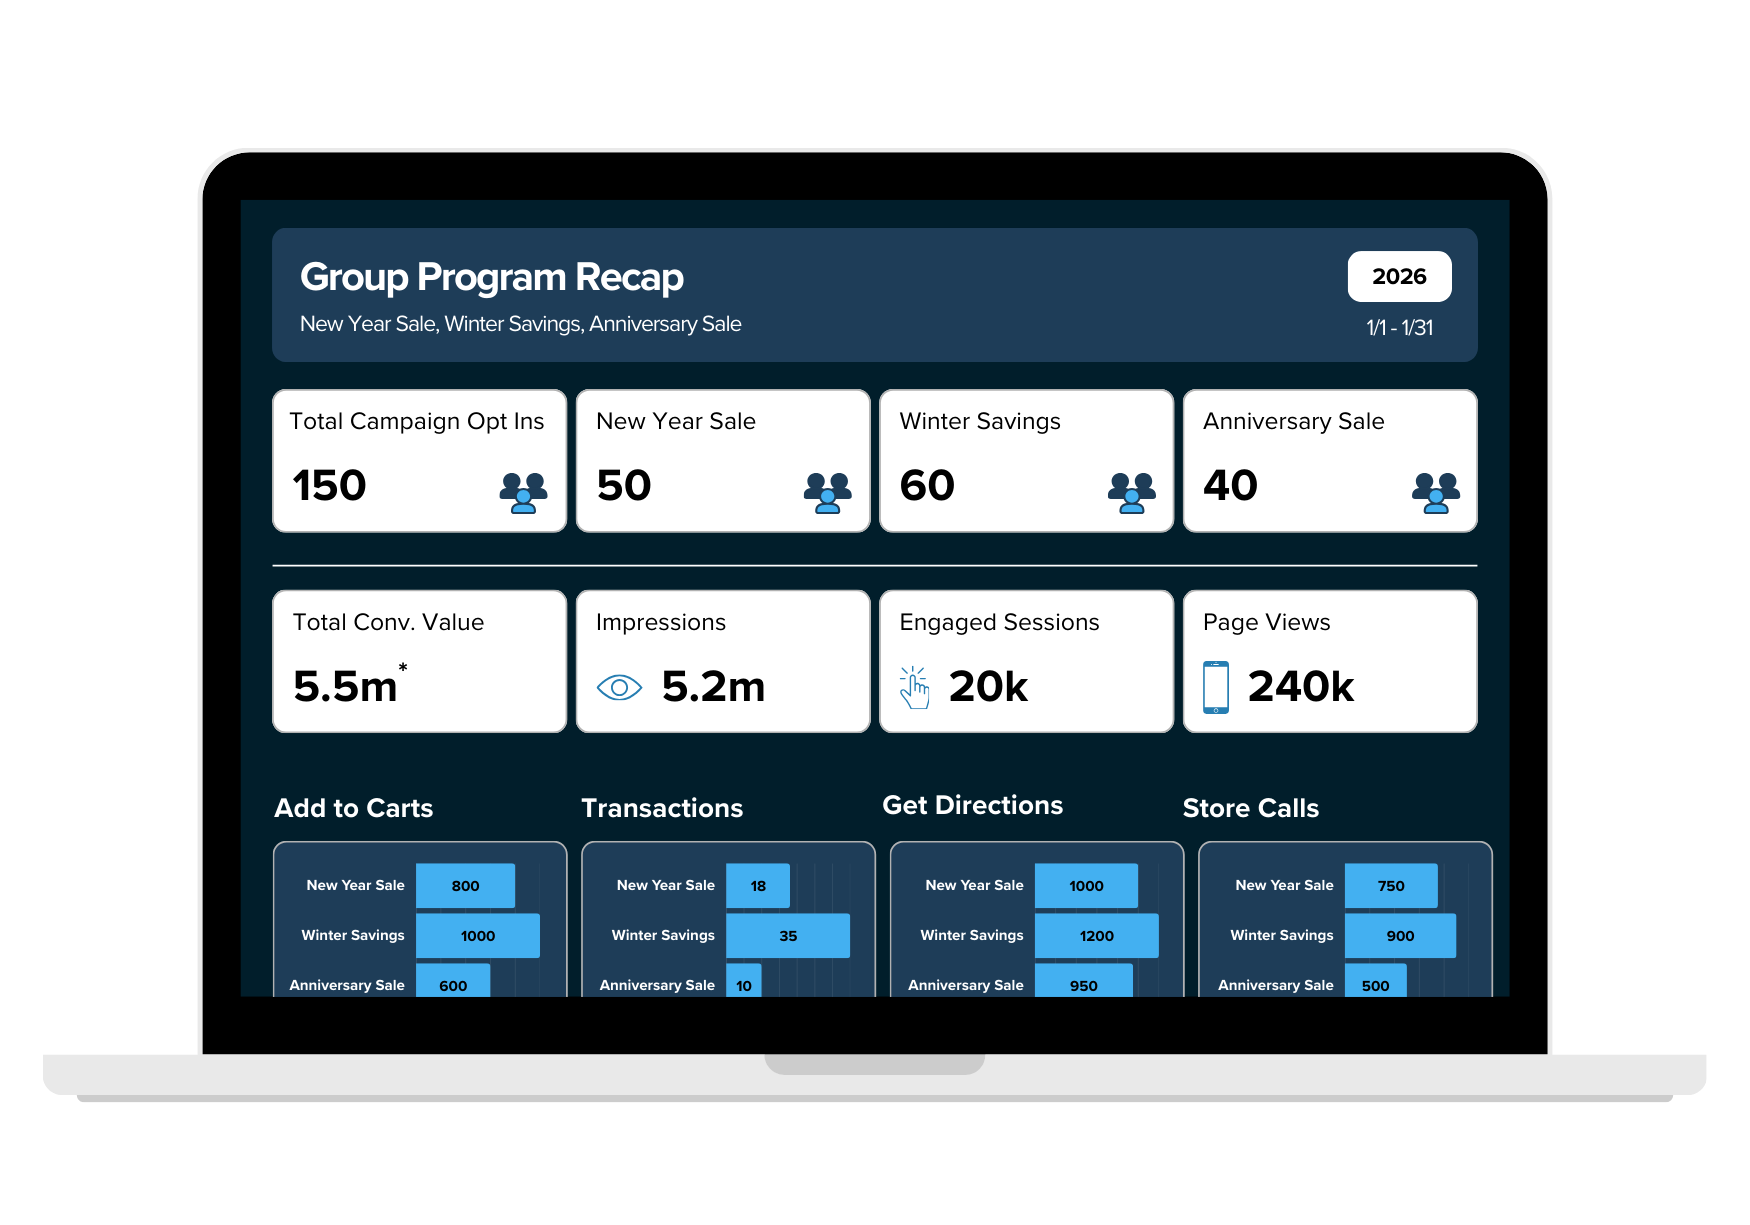
Campaign recaps focus on metrics such as total conversions, overall performance, creative impact, and period over period comparisons. These reports help teams evaluate what resonated, what can be optimized, and how future campaigns can evolve.
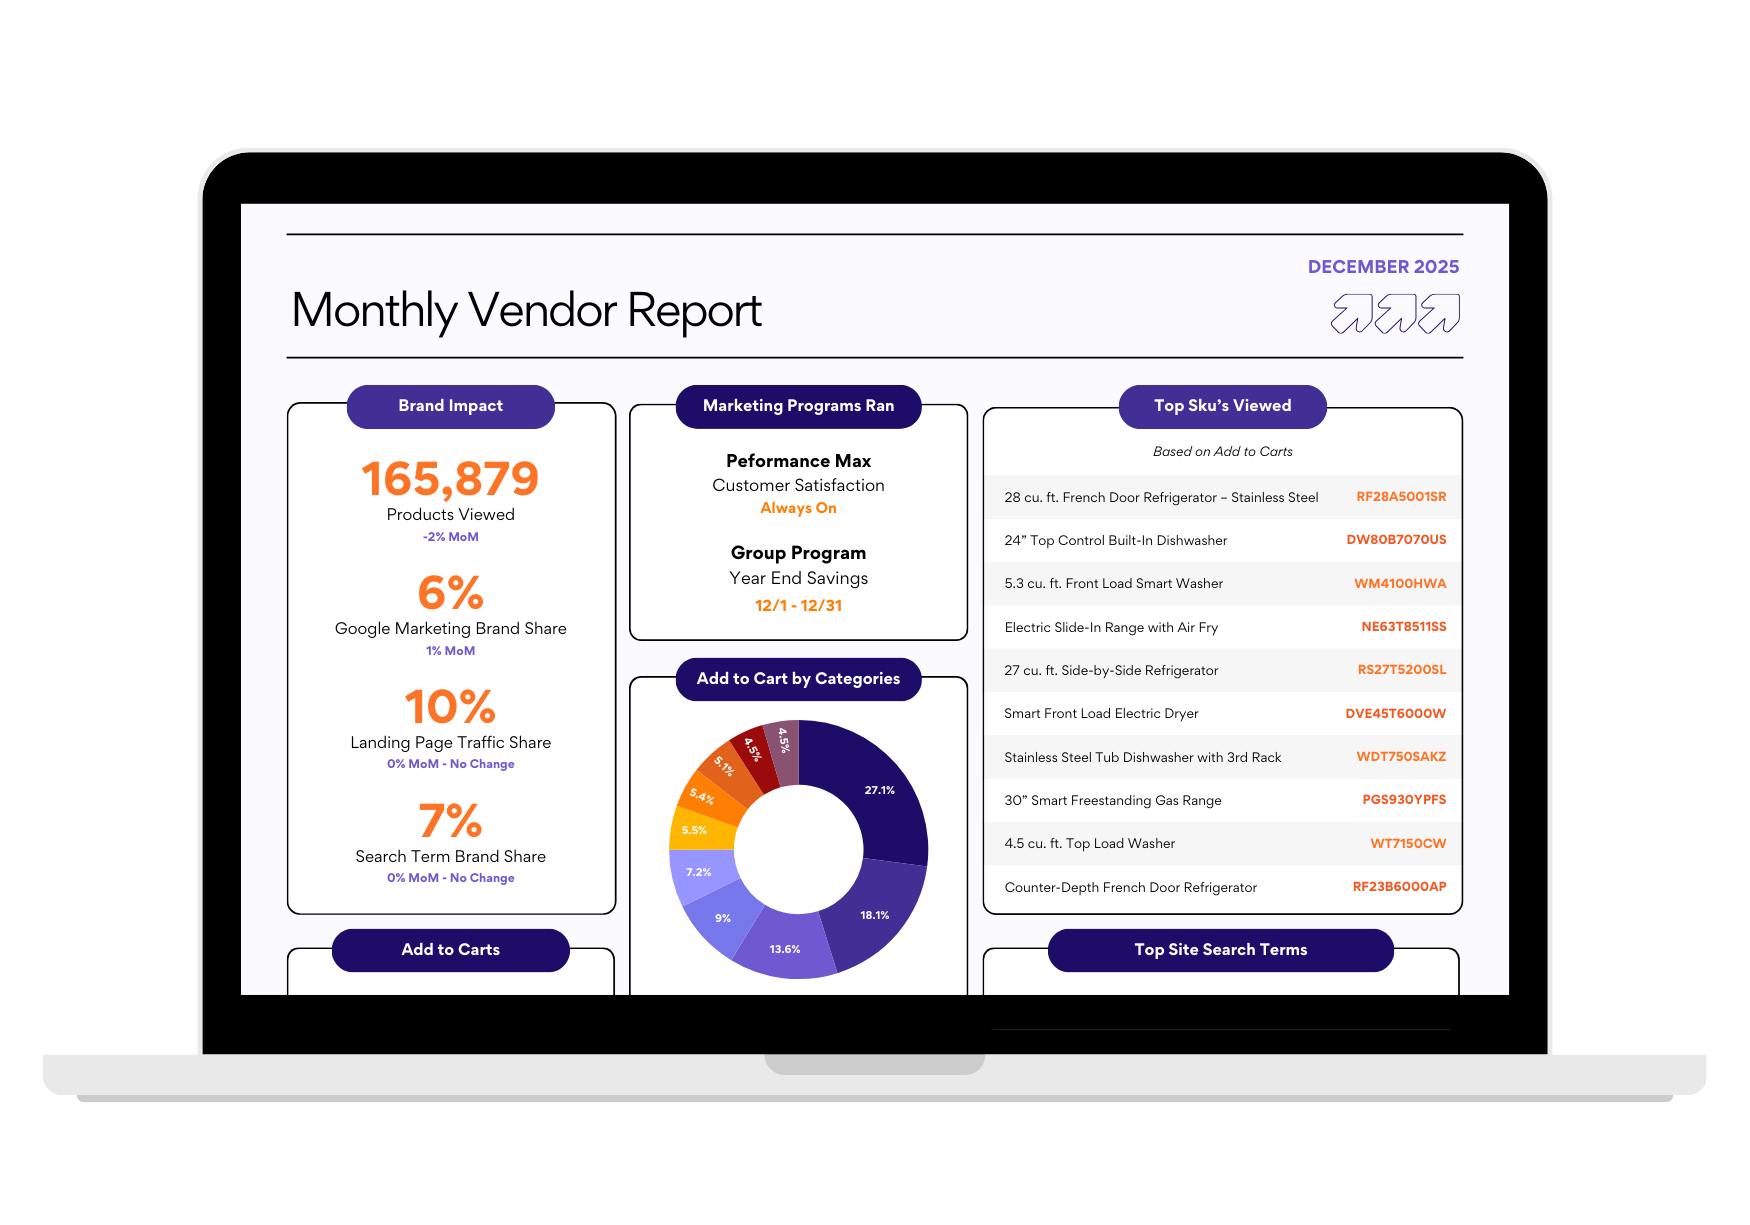
In addition to campaign reporting, I create monthly vendor infographics that provide a deeper look at brand performance across retailer sites. These include SKU engagement, share of voice, and growth opportunities.
The challenge lies in balancing data density with visual clarity. Each infographic must communicate insights quickly while remaining engaging, digestible, and actionable for a range of audiences, from internal stakeholders to external brand partners.